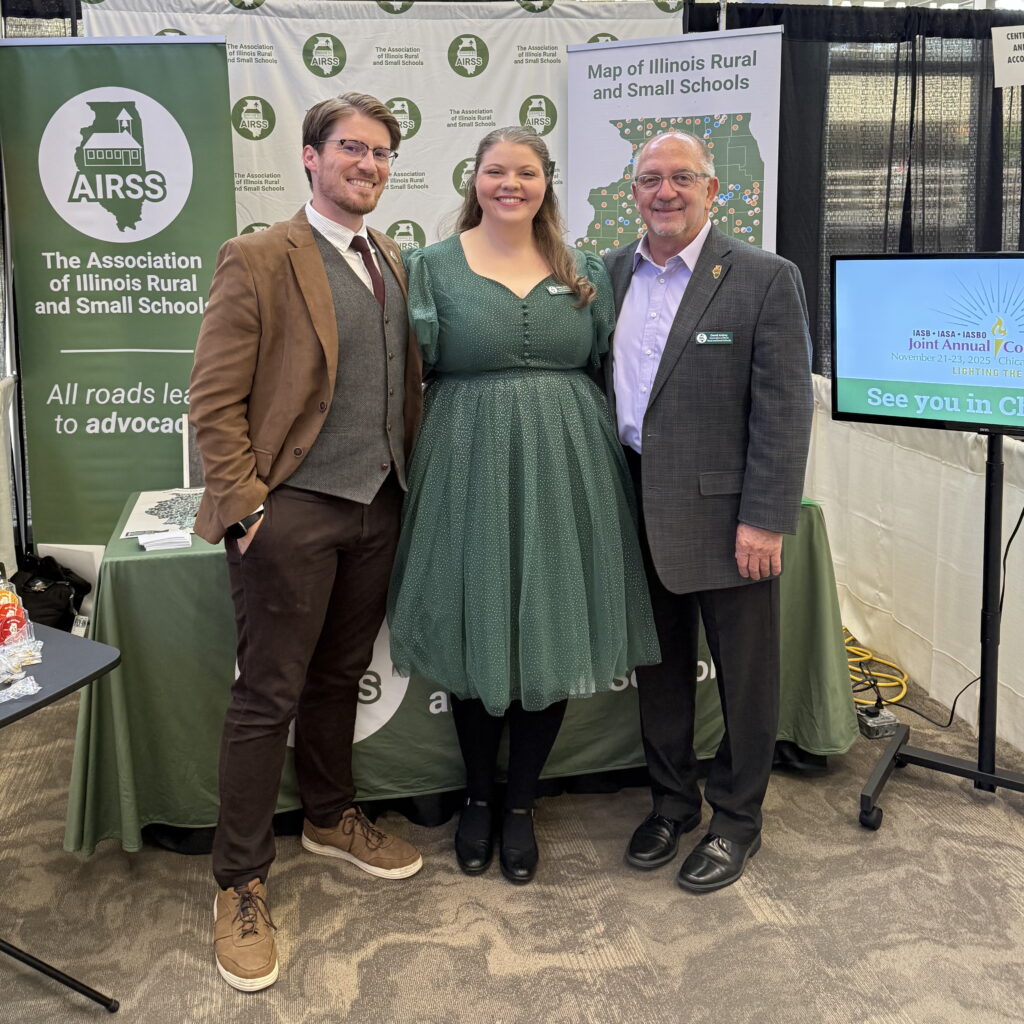
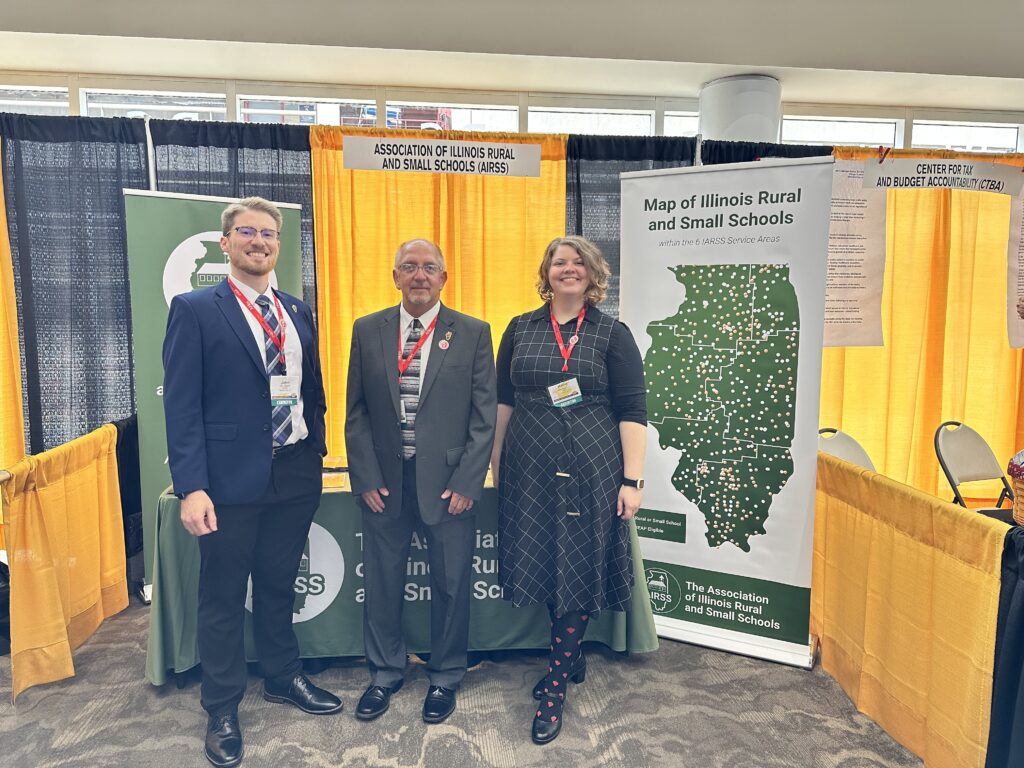
The Association of Illinois Rural and Small Schools (AIRSS) is the only advocacy group in Illinois that focuses specifically on the issues of rural schools. EECS has been involved with AIRSS since 2018, helping with a complete rebrand, a new website, event planning, and more!
The Work
- Design and maintenance of website
- Weekly newsletter
- Direct mail campaigns
- Annual report design and printing
- Communications support for passage of Illinois Senate Bill 1787
- Partnership with Miss Illinois Ariel Beverly
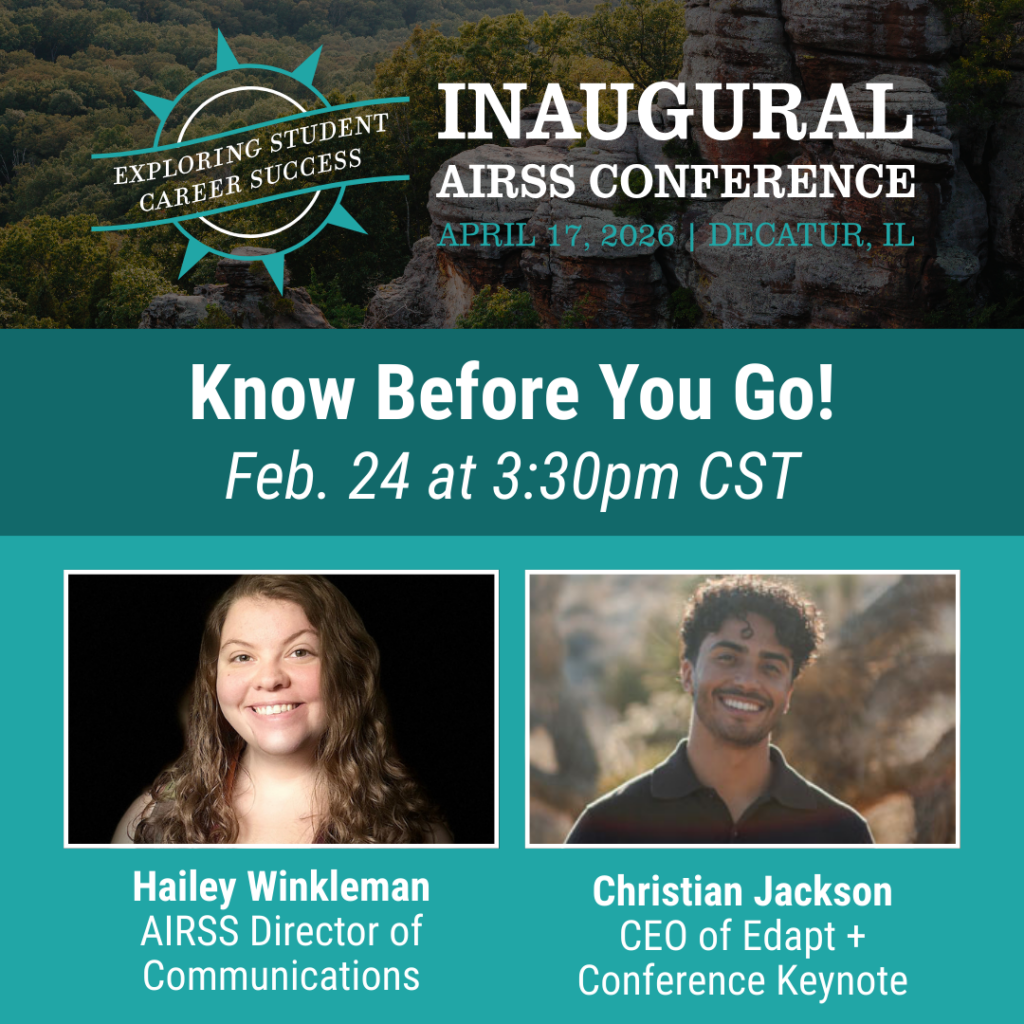
- Inaugural AIRSS Conference coordination
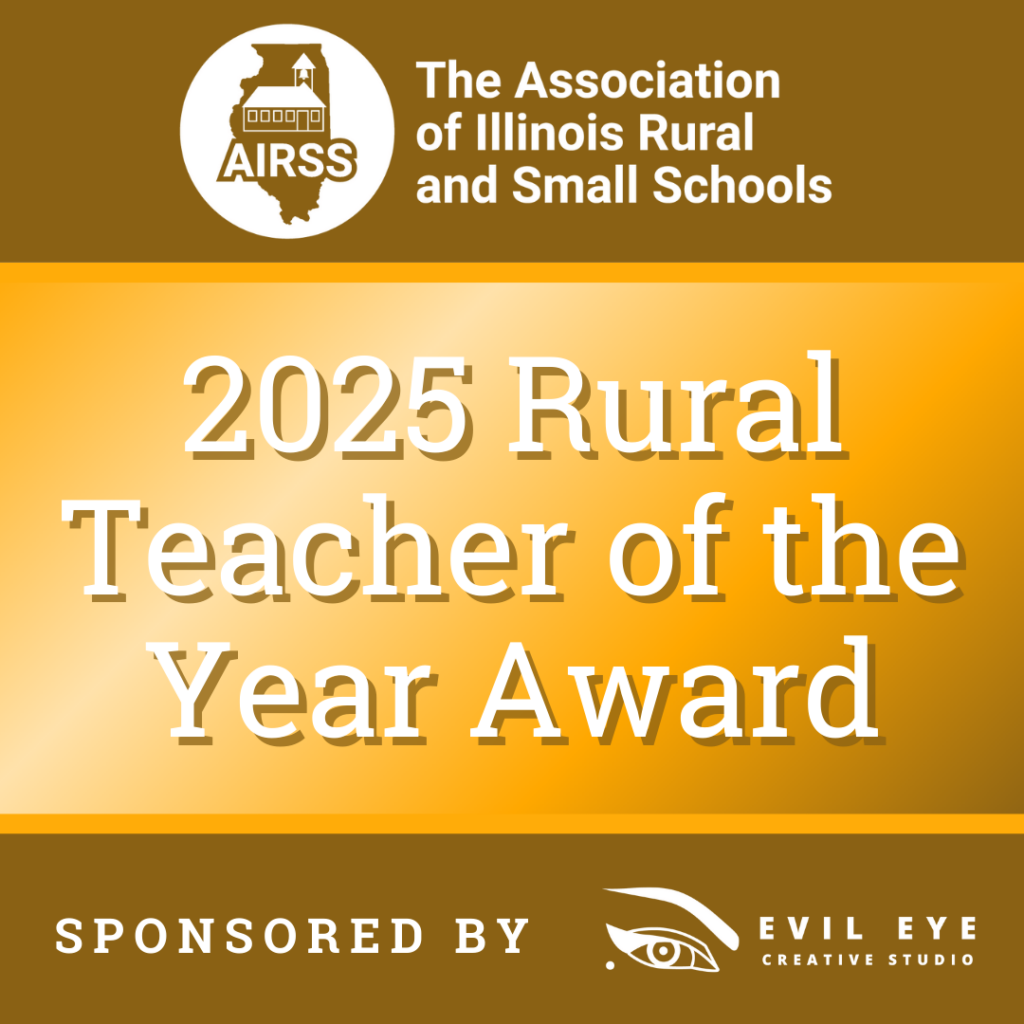
- Launch and sponsorship of Illinois Rural Teacher of the Year Program
- Creation of Rural IL CTE Portal
- Design of Prairie Career Advocate publication
- Design of Rural IL CTE Project reports each year


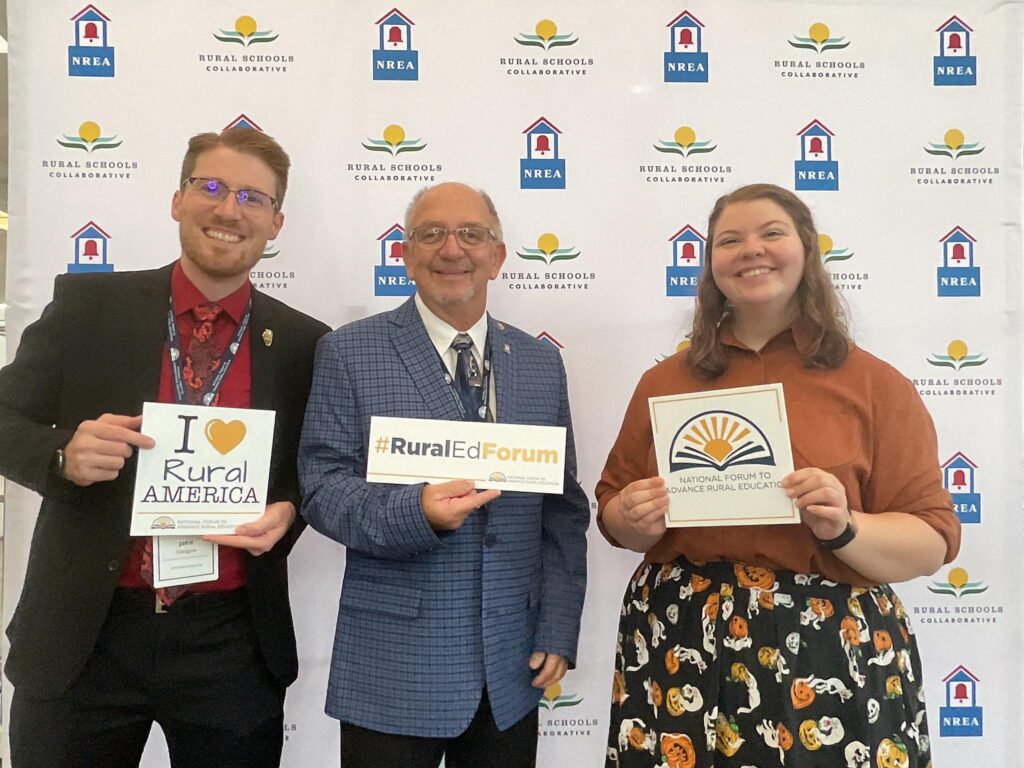

I Am A Rural Teacher
Project Logos
Any time a project or IAART derivative needed a mark, I created it.
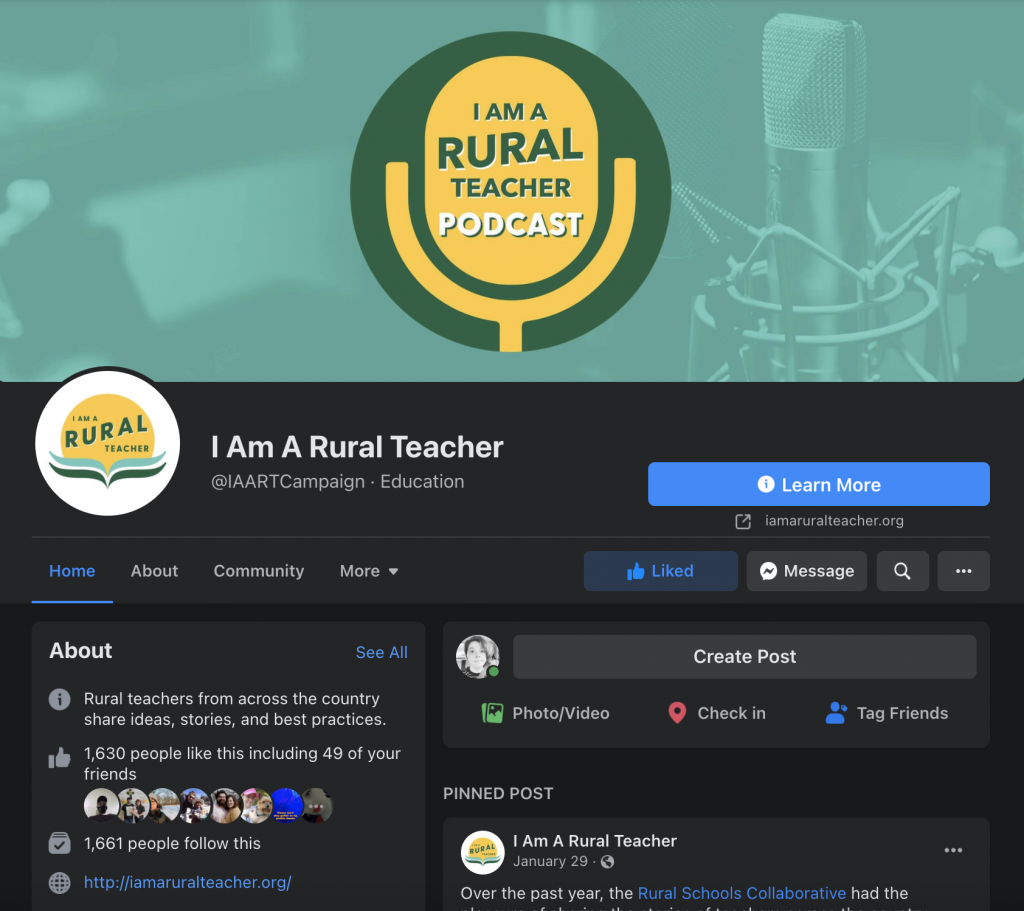
Social Media Marketing
Throughout the campaign, I designed social media graphics, produced videos, and handled scheduling through Buffer. I used these tools and several projects – including a pivot concerning COVID-19, and 50 States in 50 Weeks, which you’ll see below – to collect over 100 teacher-submitted perspectives, and I grew the Facebook page from 0 to over 1600 by the end of the year.

Web Articles
I updated the IAART website almost daily to include new stories from our submissions, which included creating the cover graphic, editing the article, and in many cases writing additional copy for clarification. I also syndicated some of the work to local news sources upon the request of applicants, which meant reformatting stories as press releases. During the IAART campaign, the RSC website also saw a huge boost in traffic.
Video Work
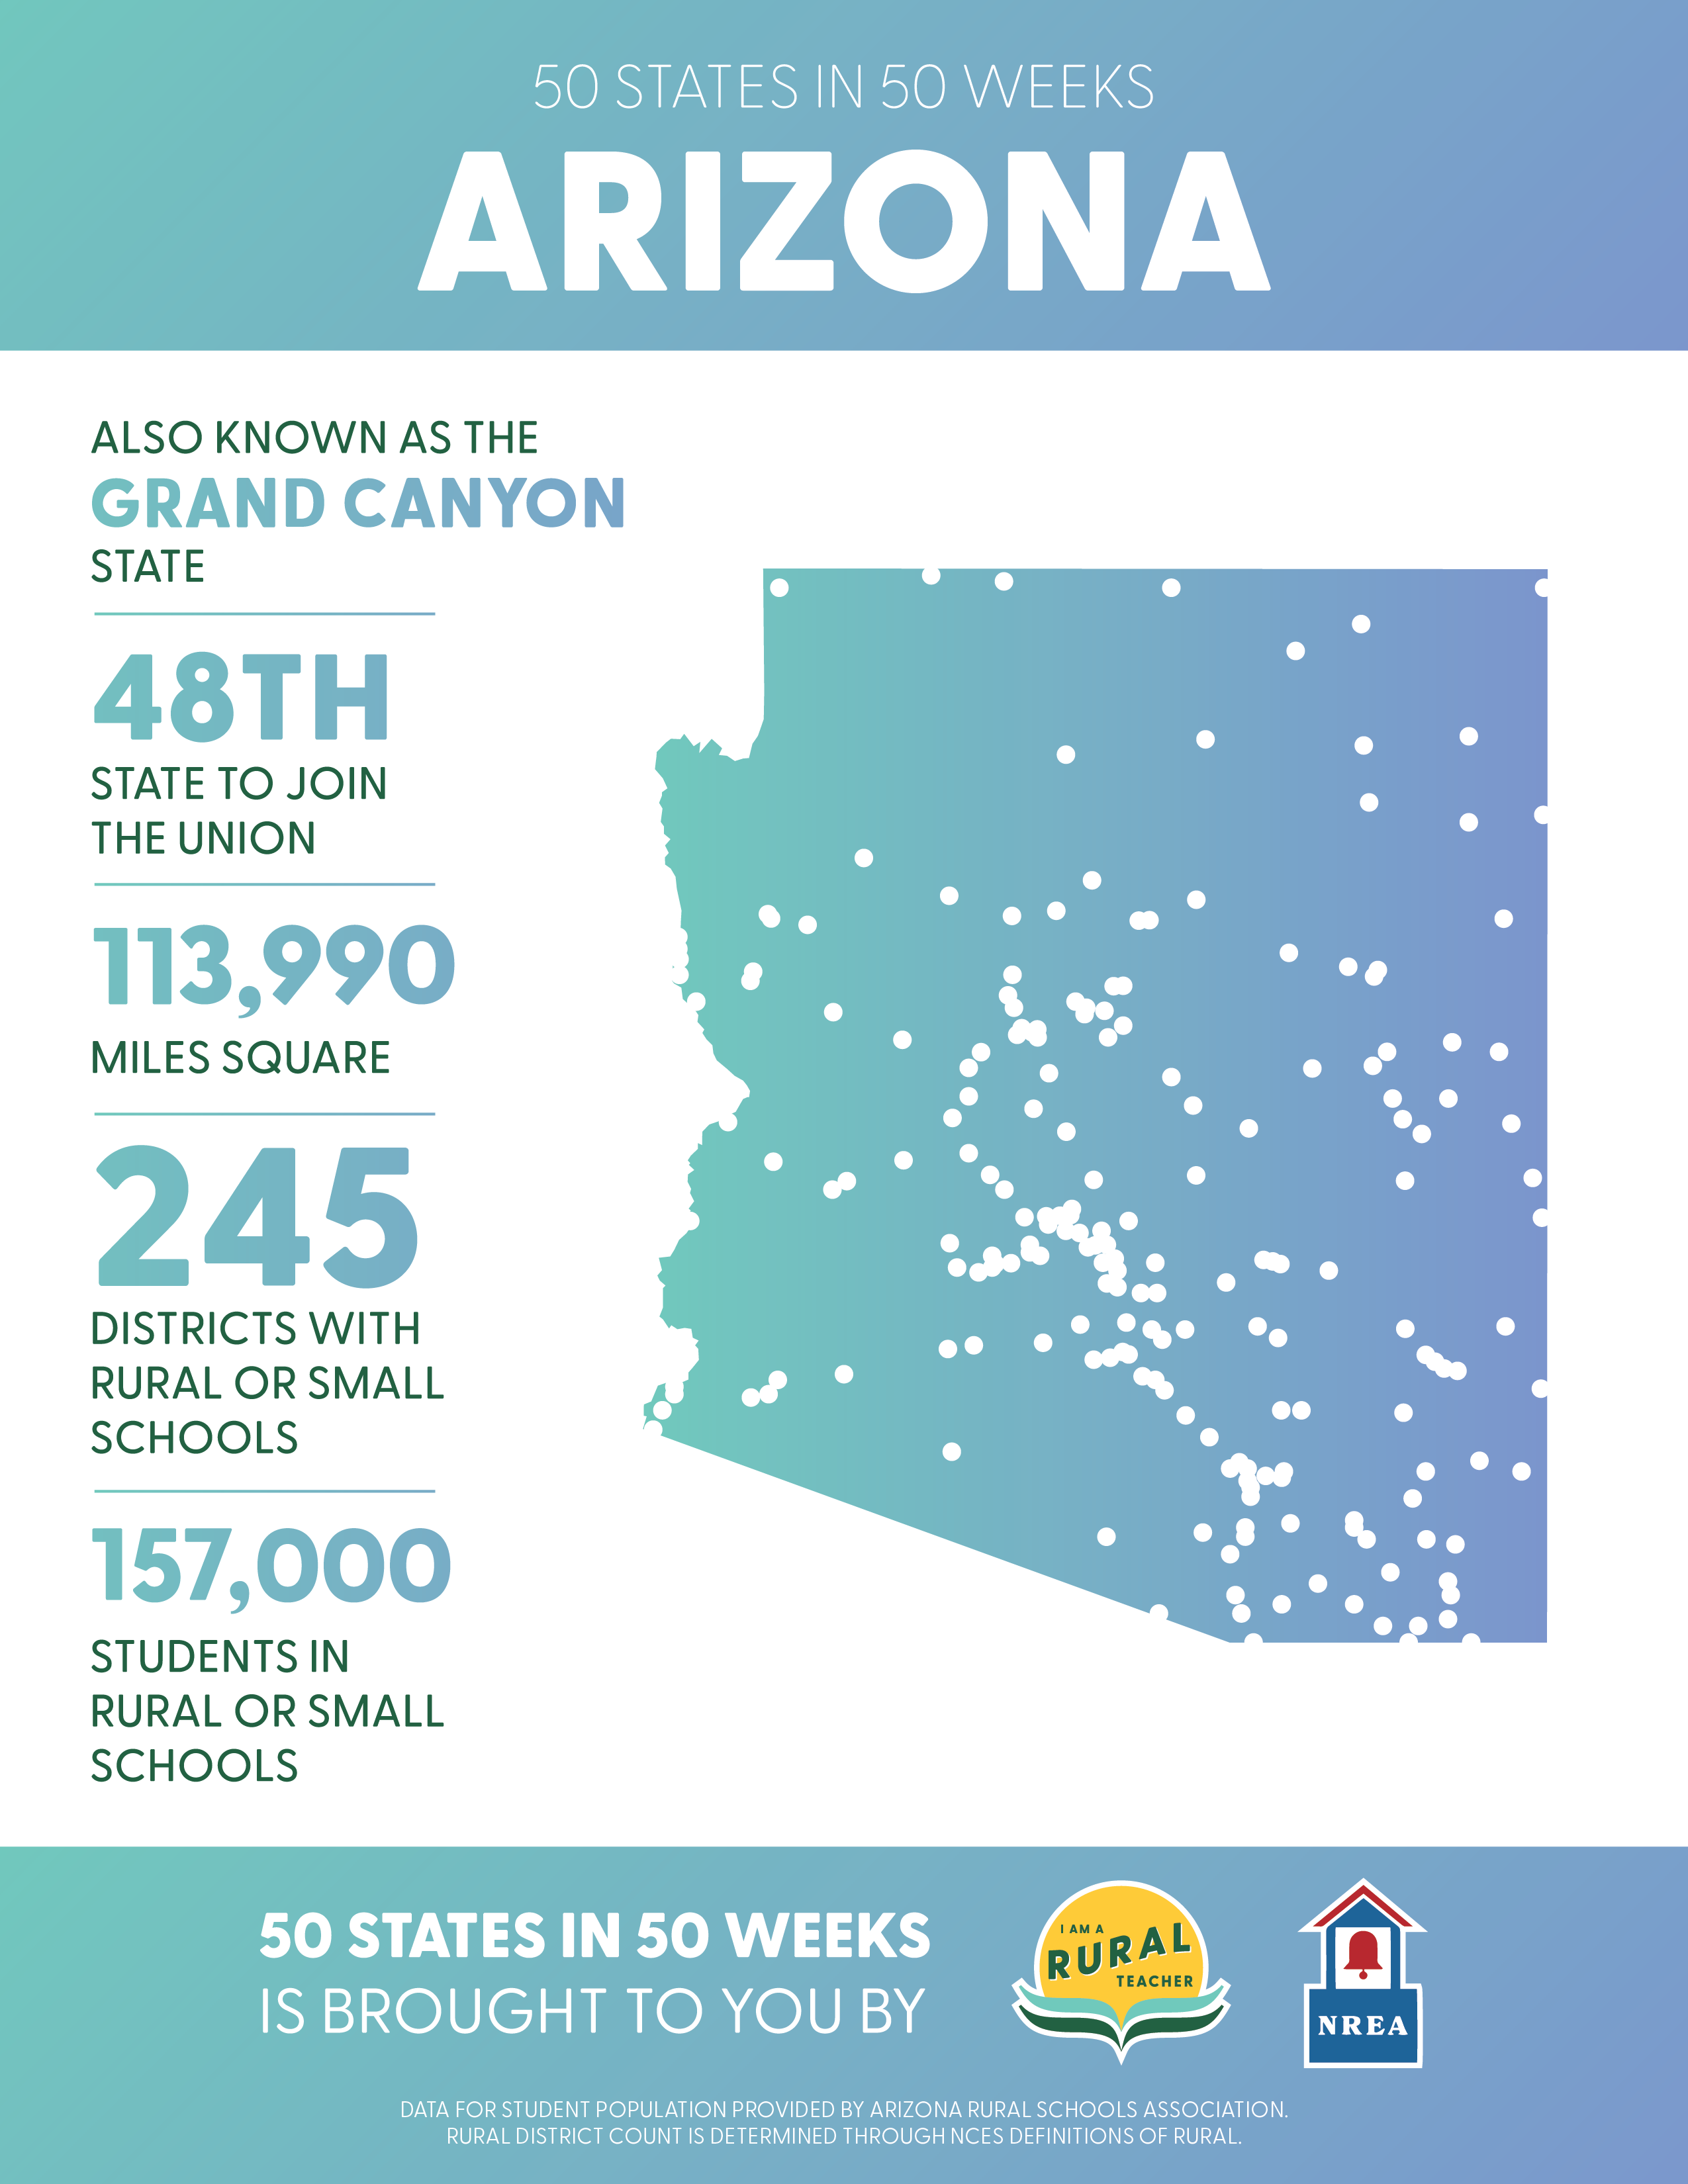
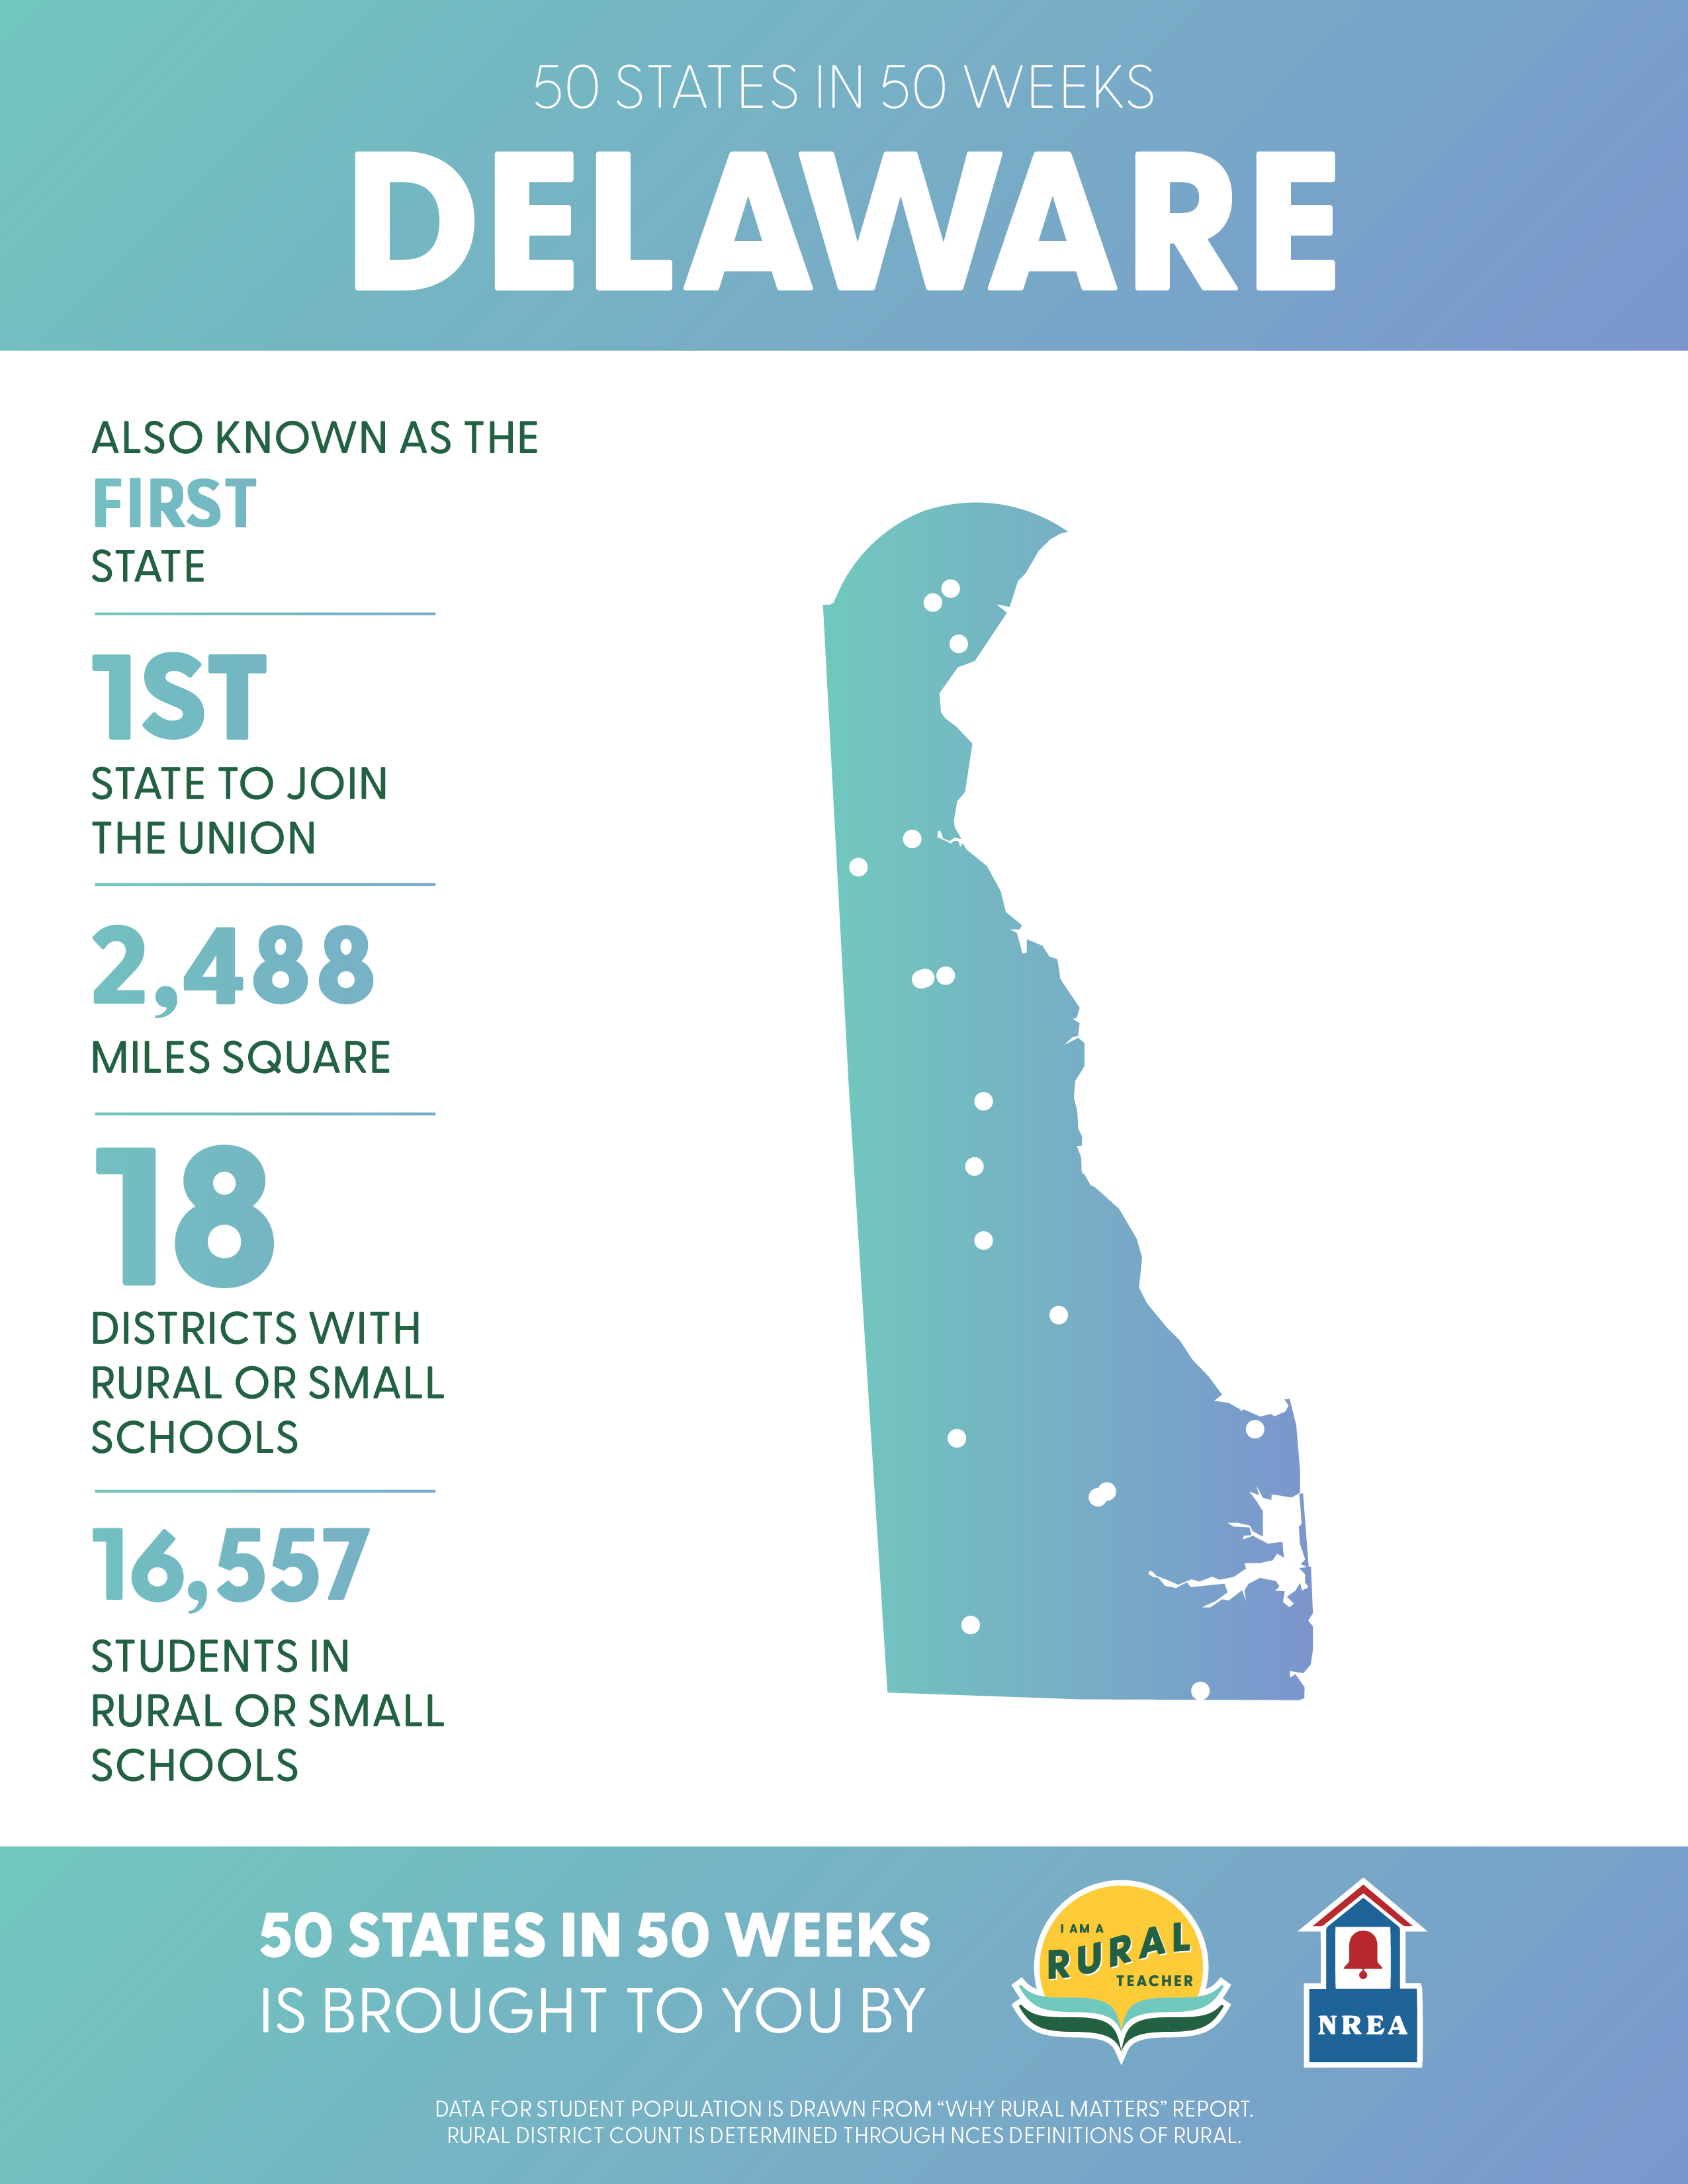
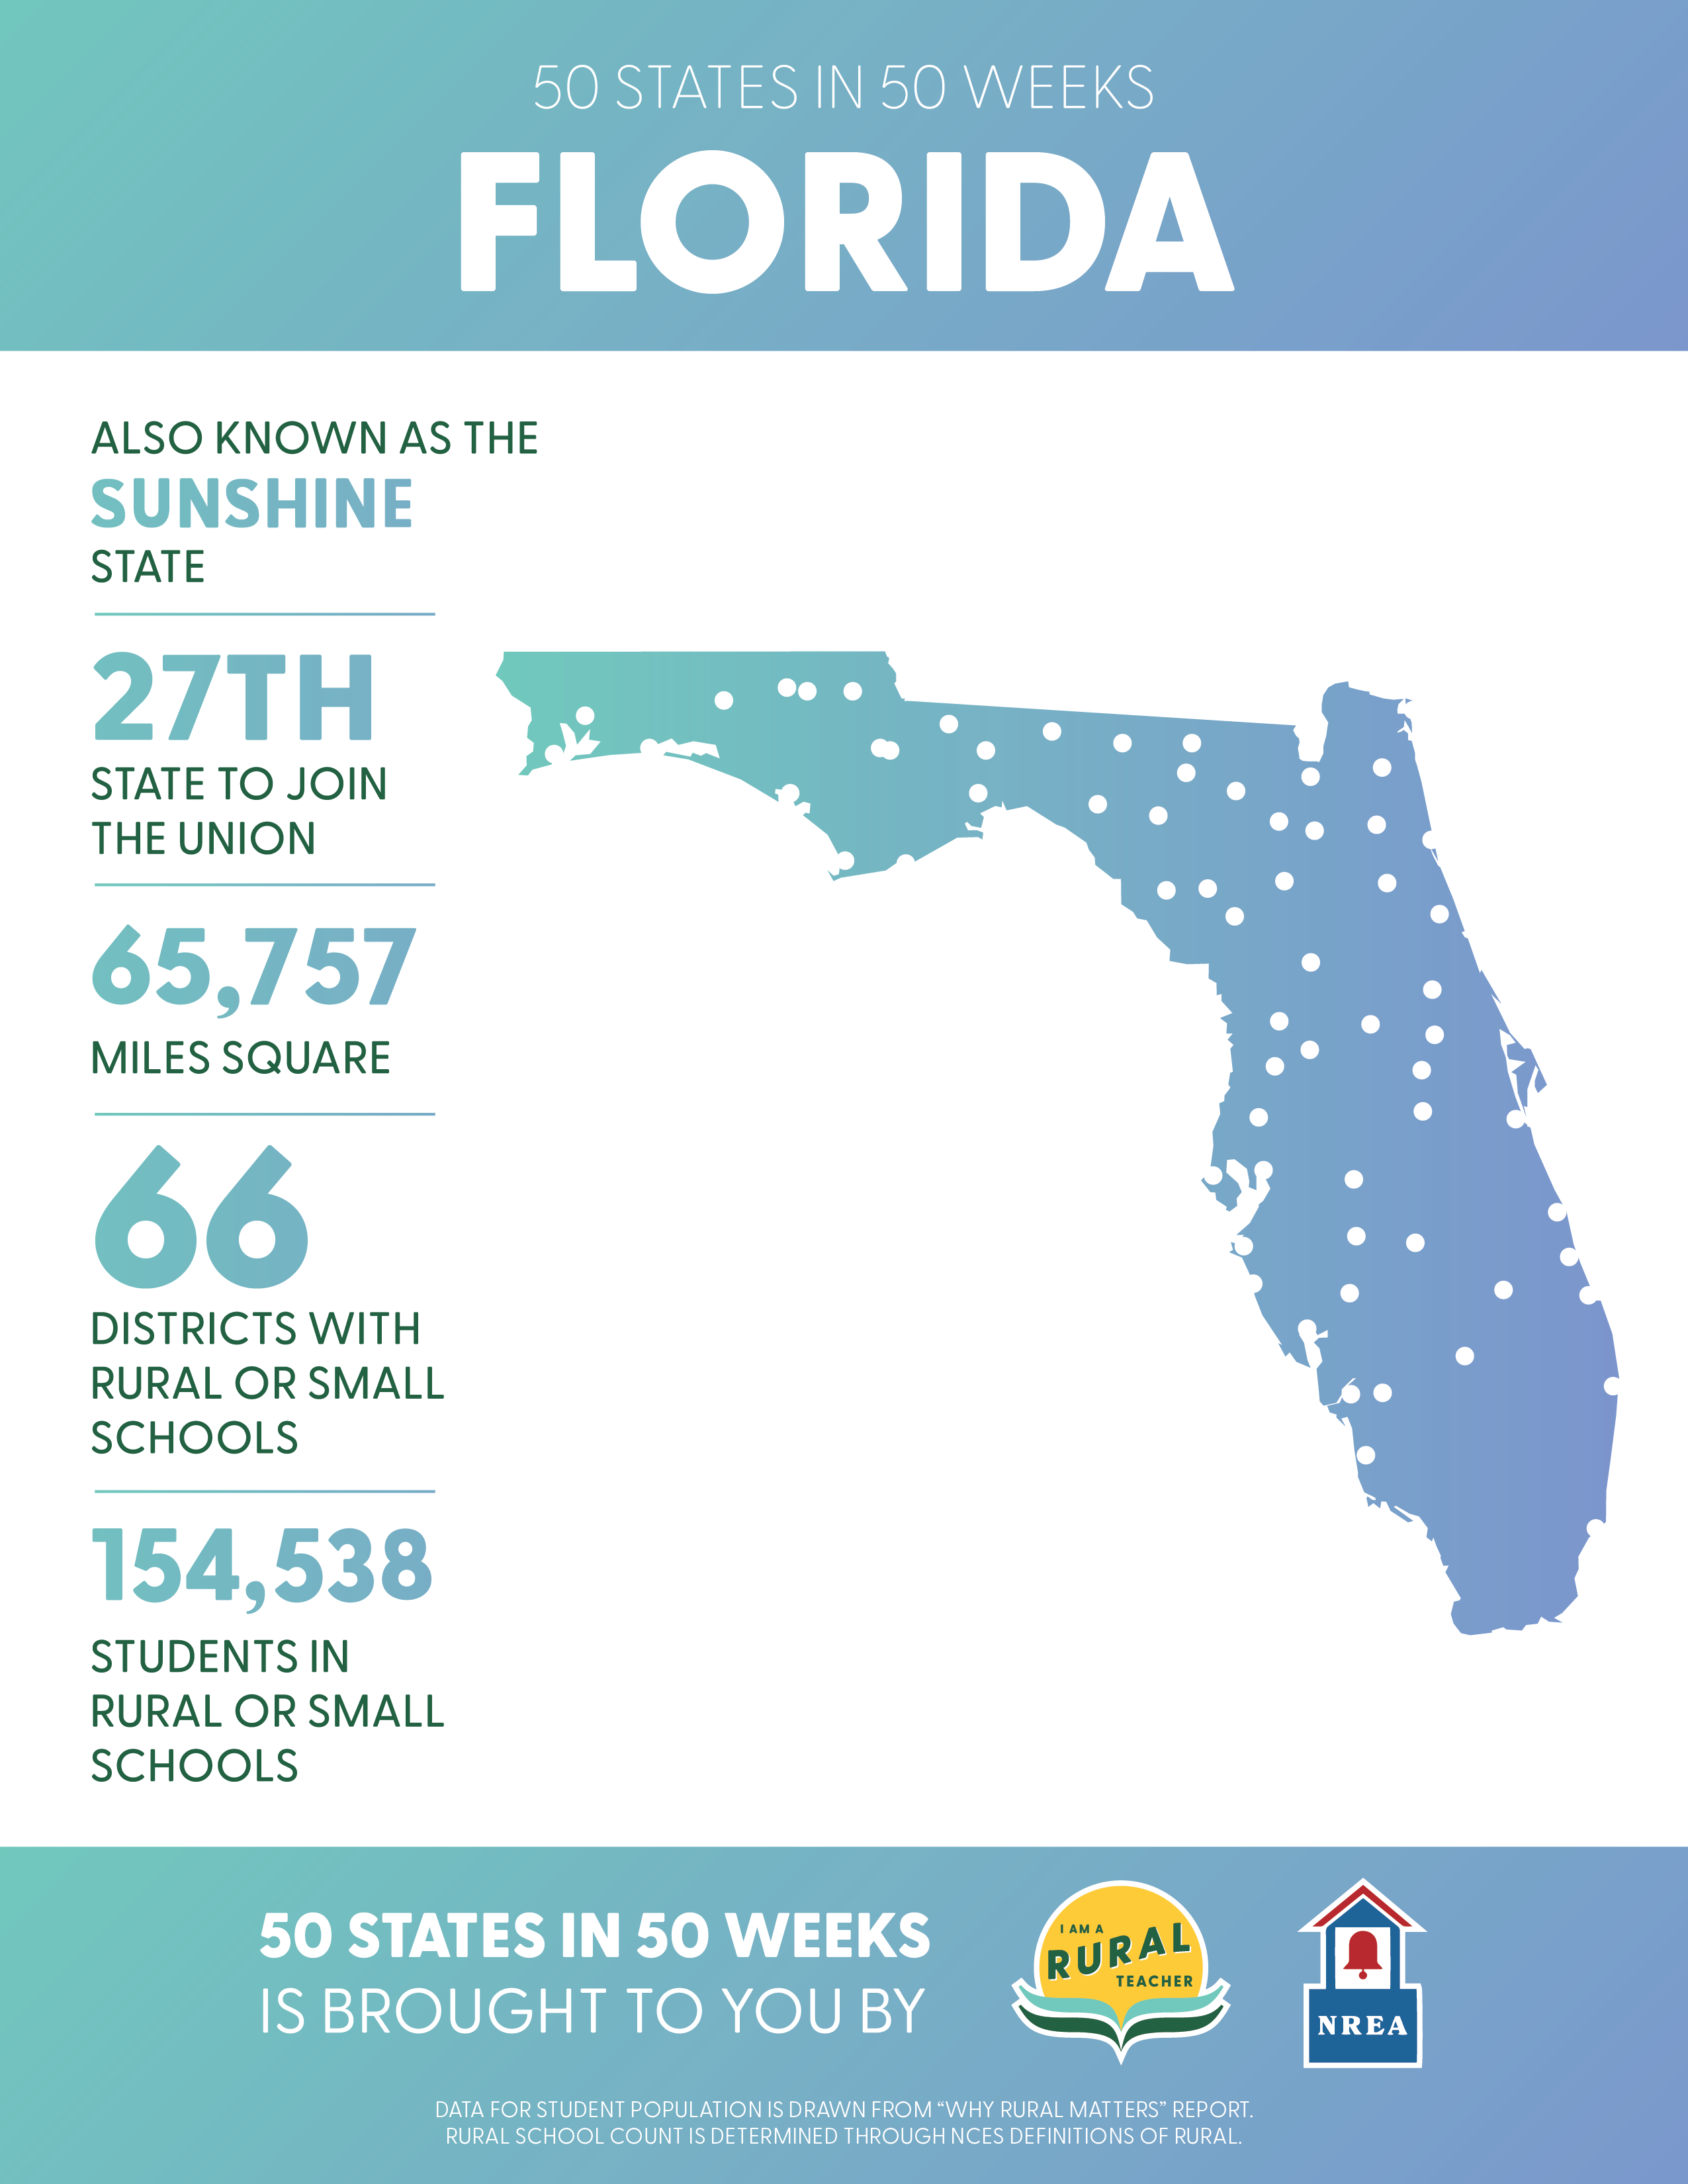
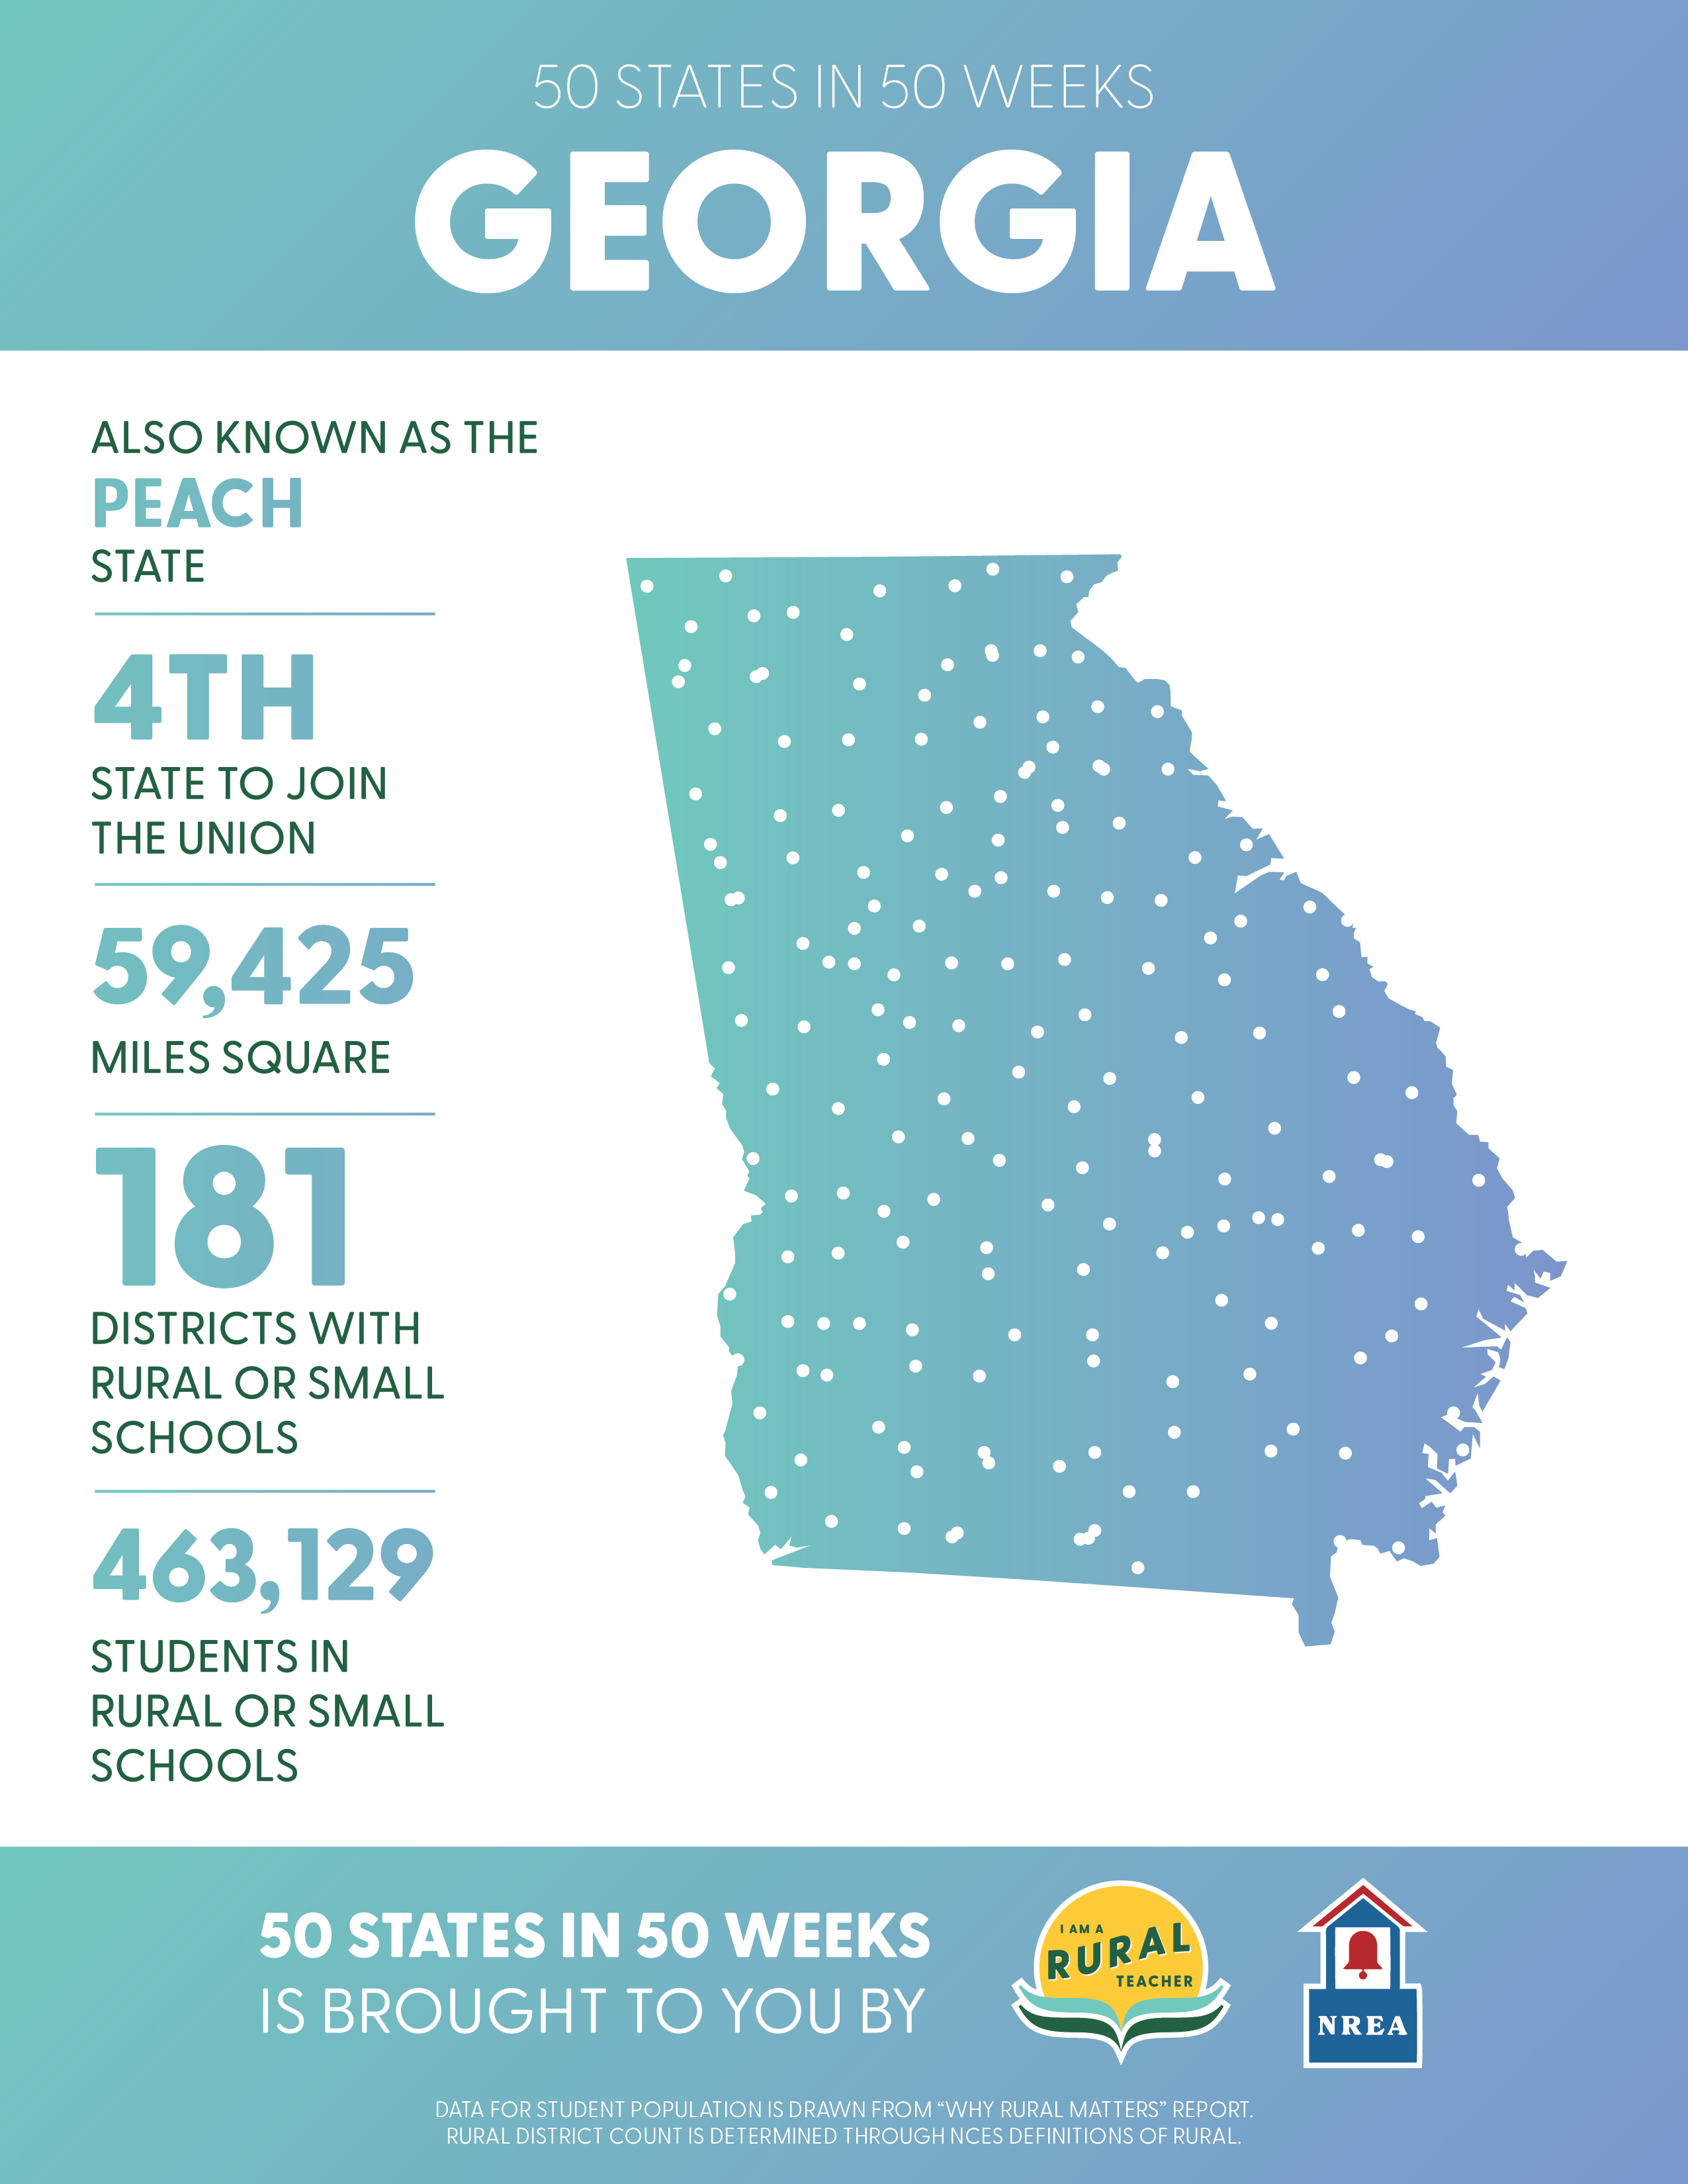
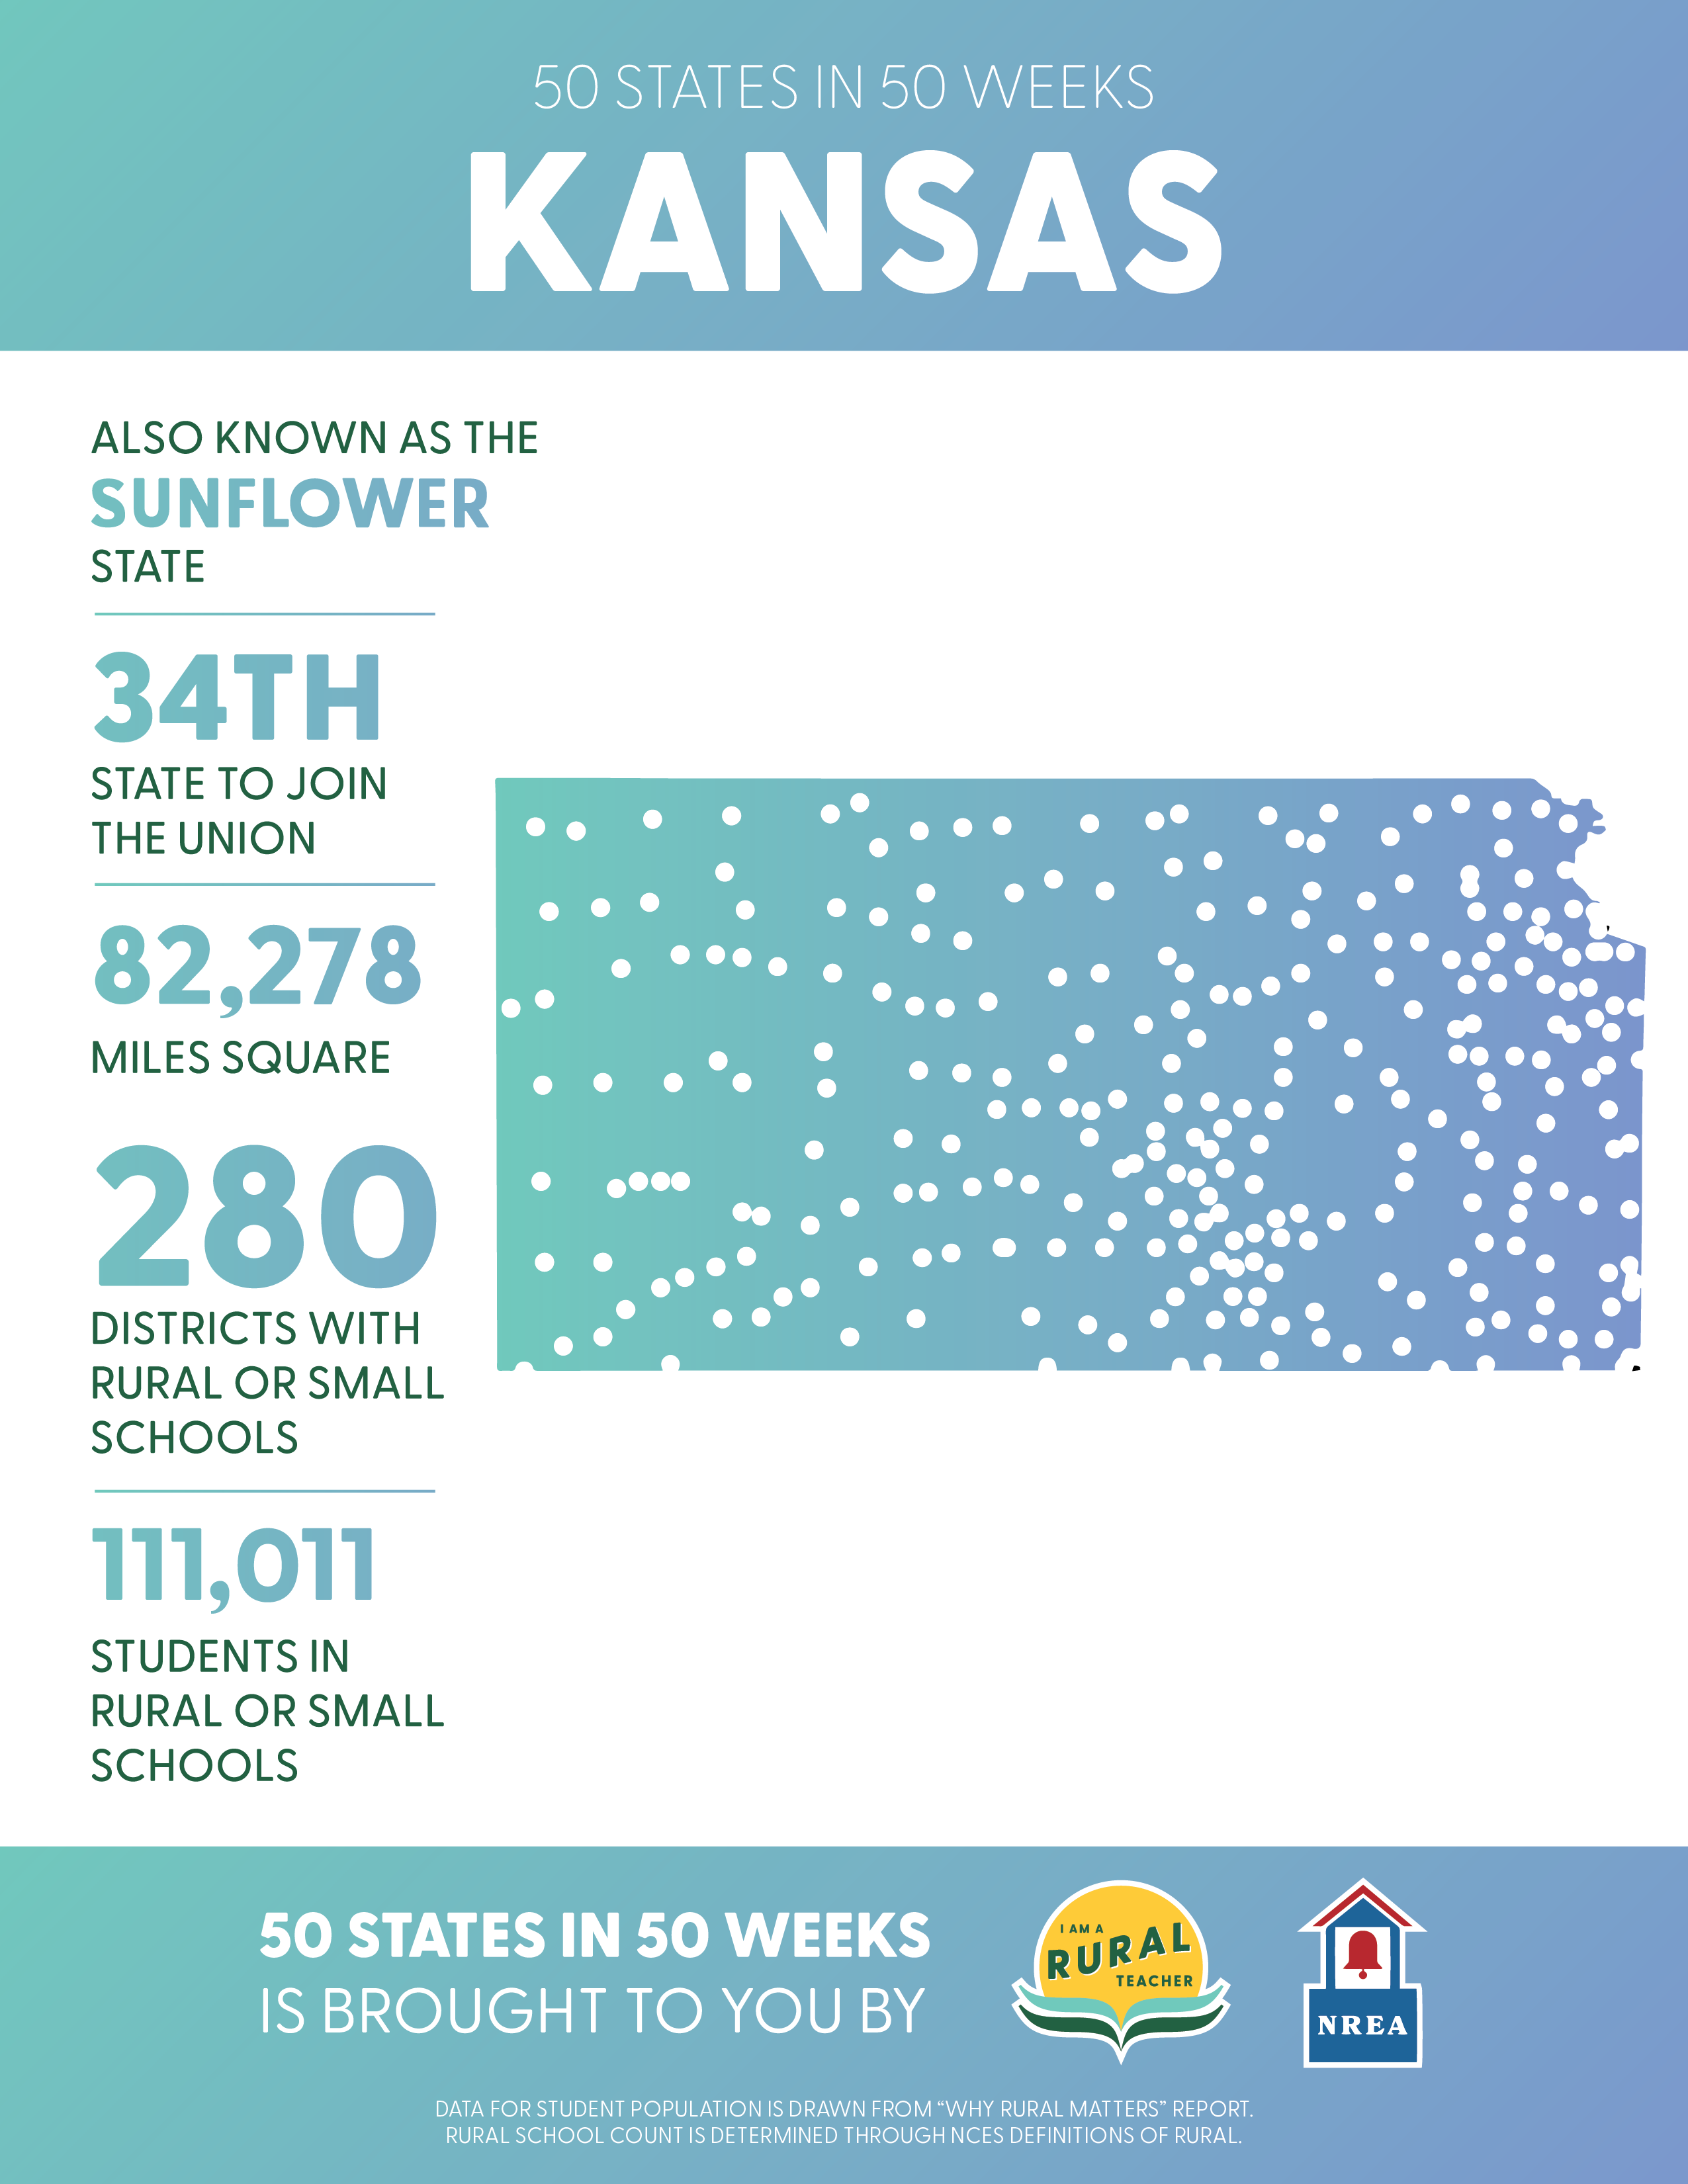
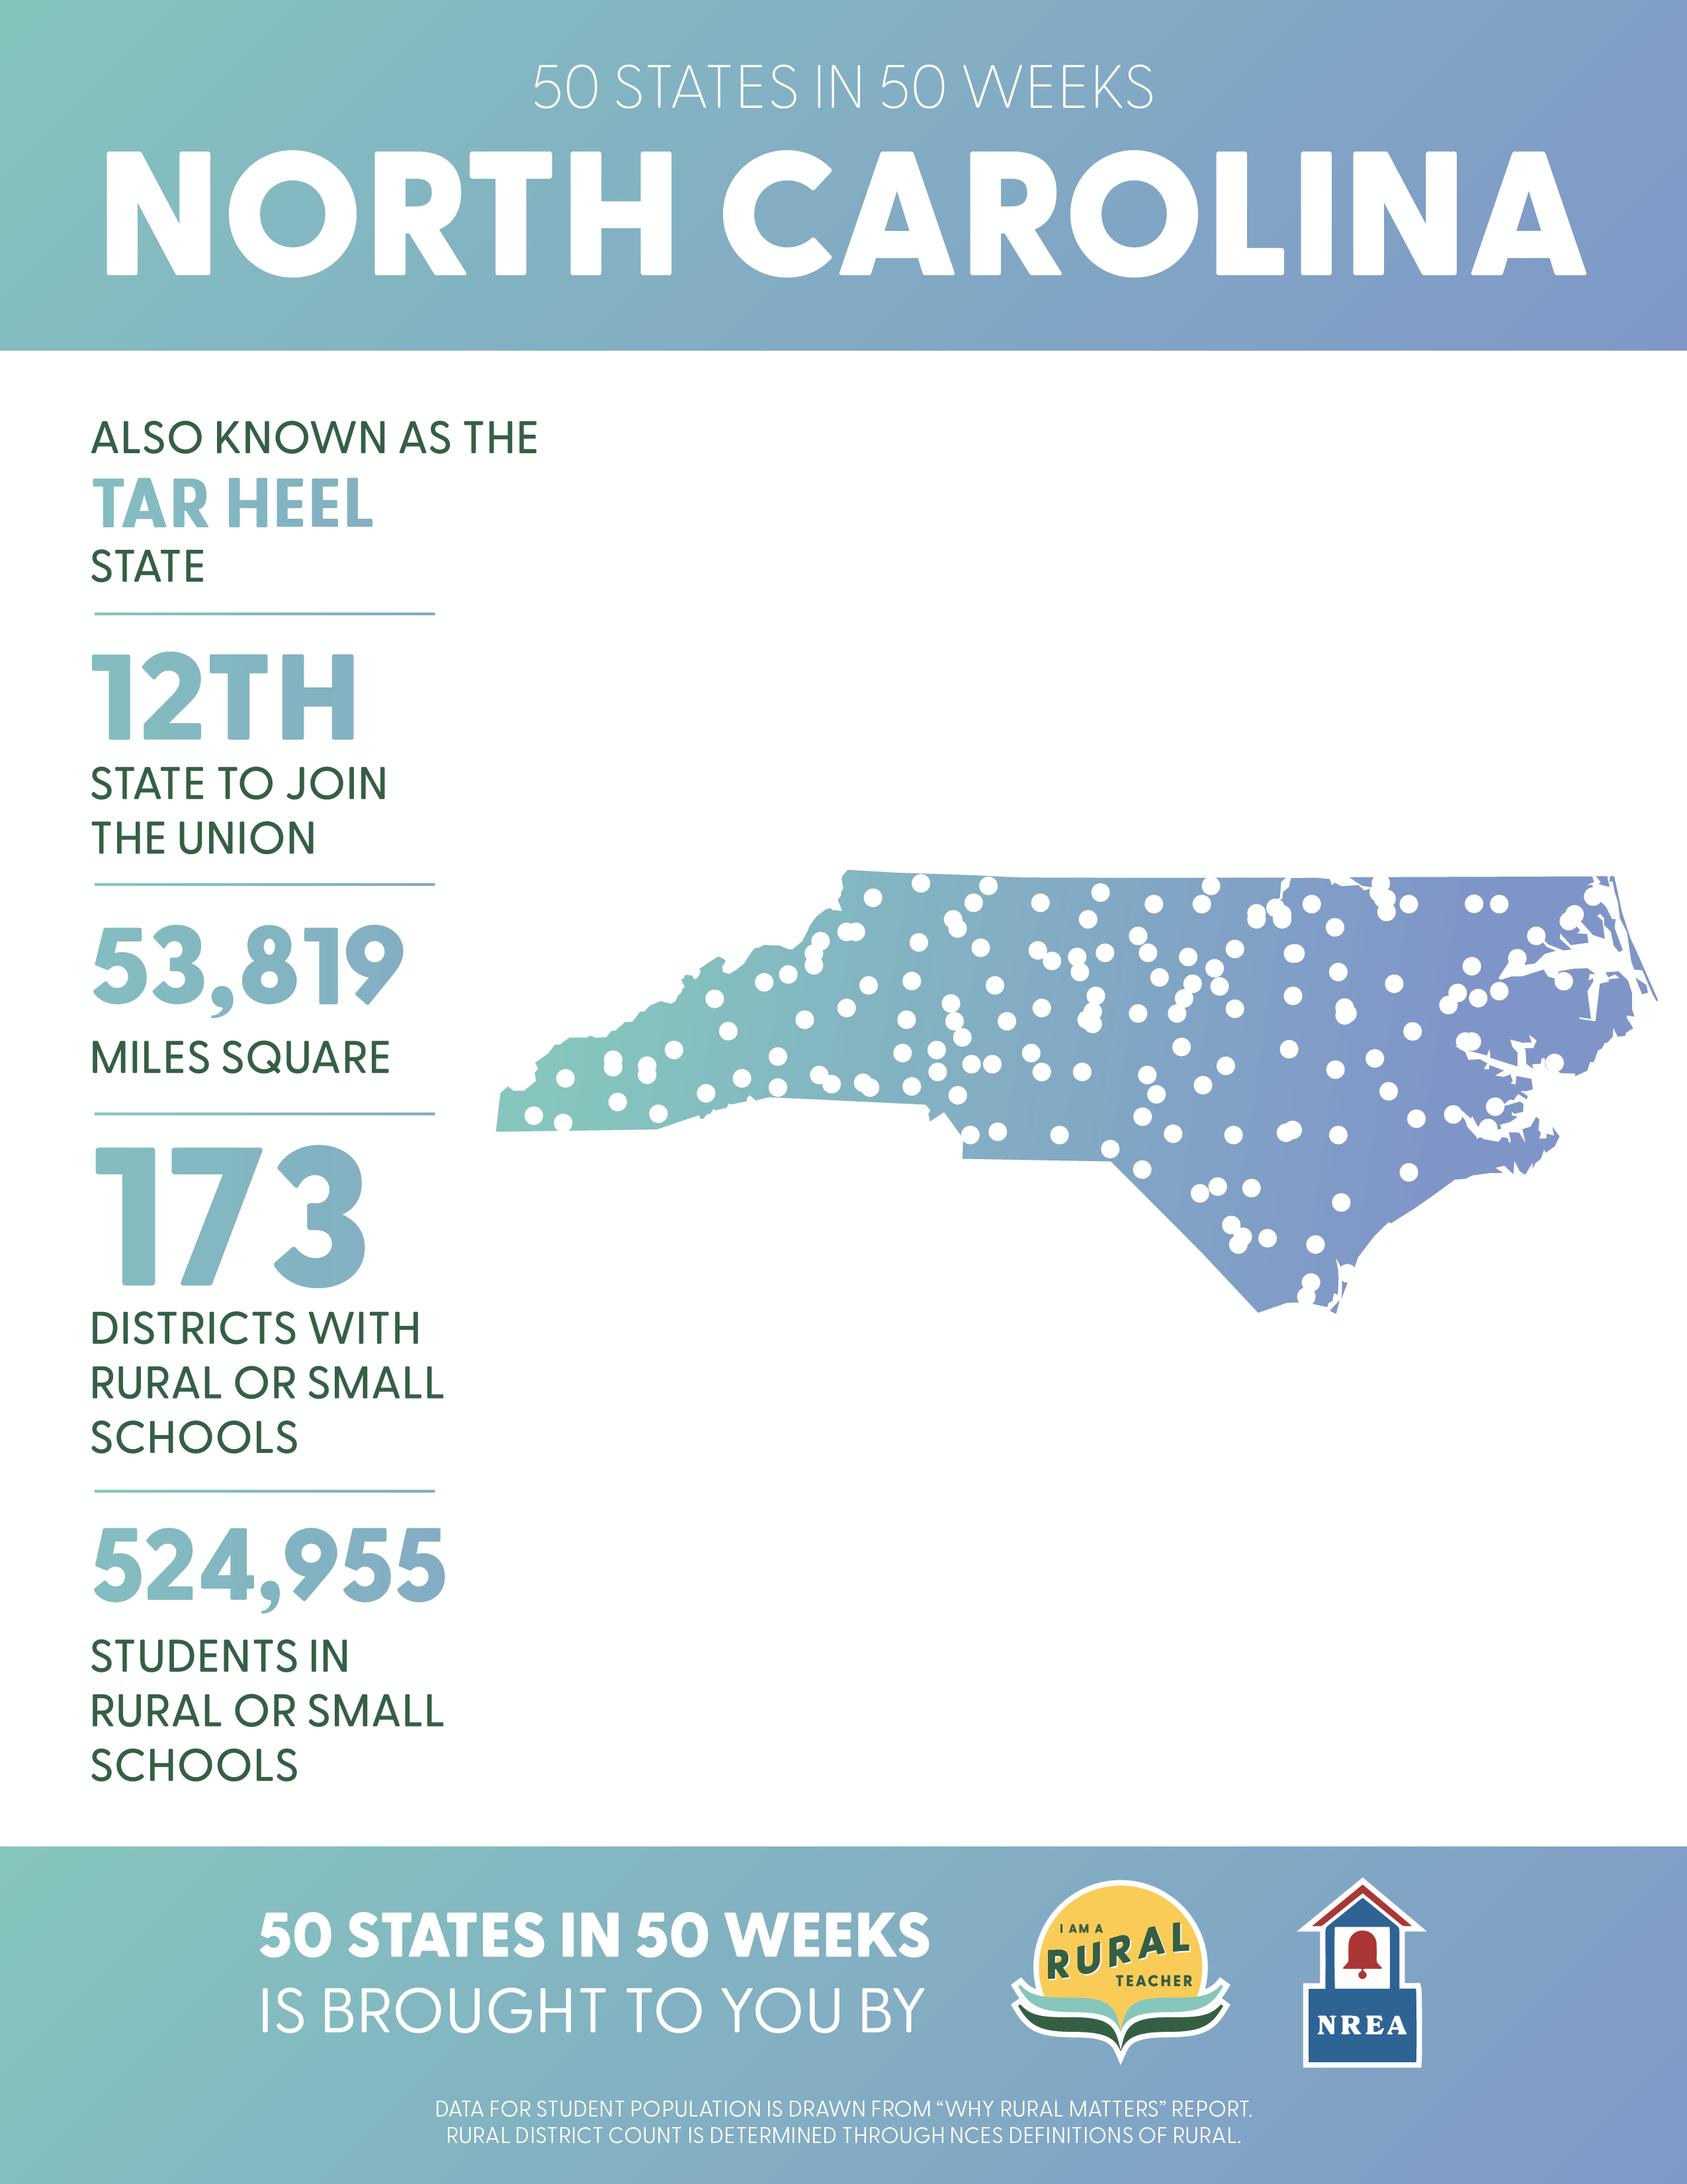
50 States in 50 Weeks
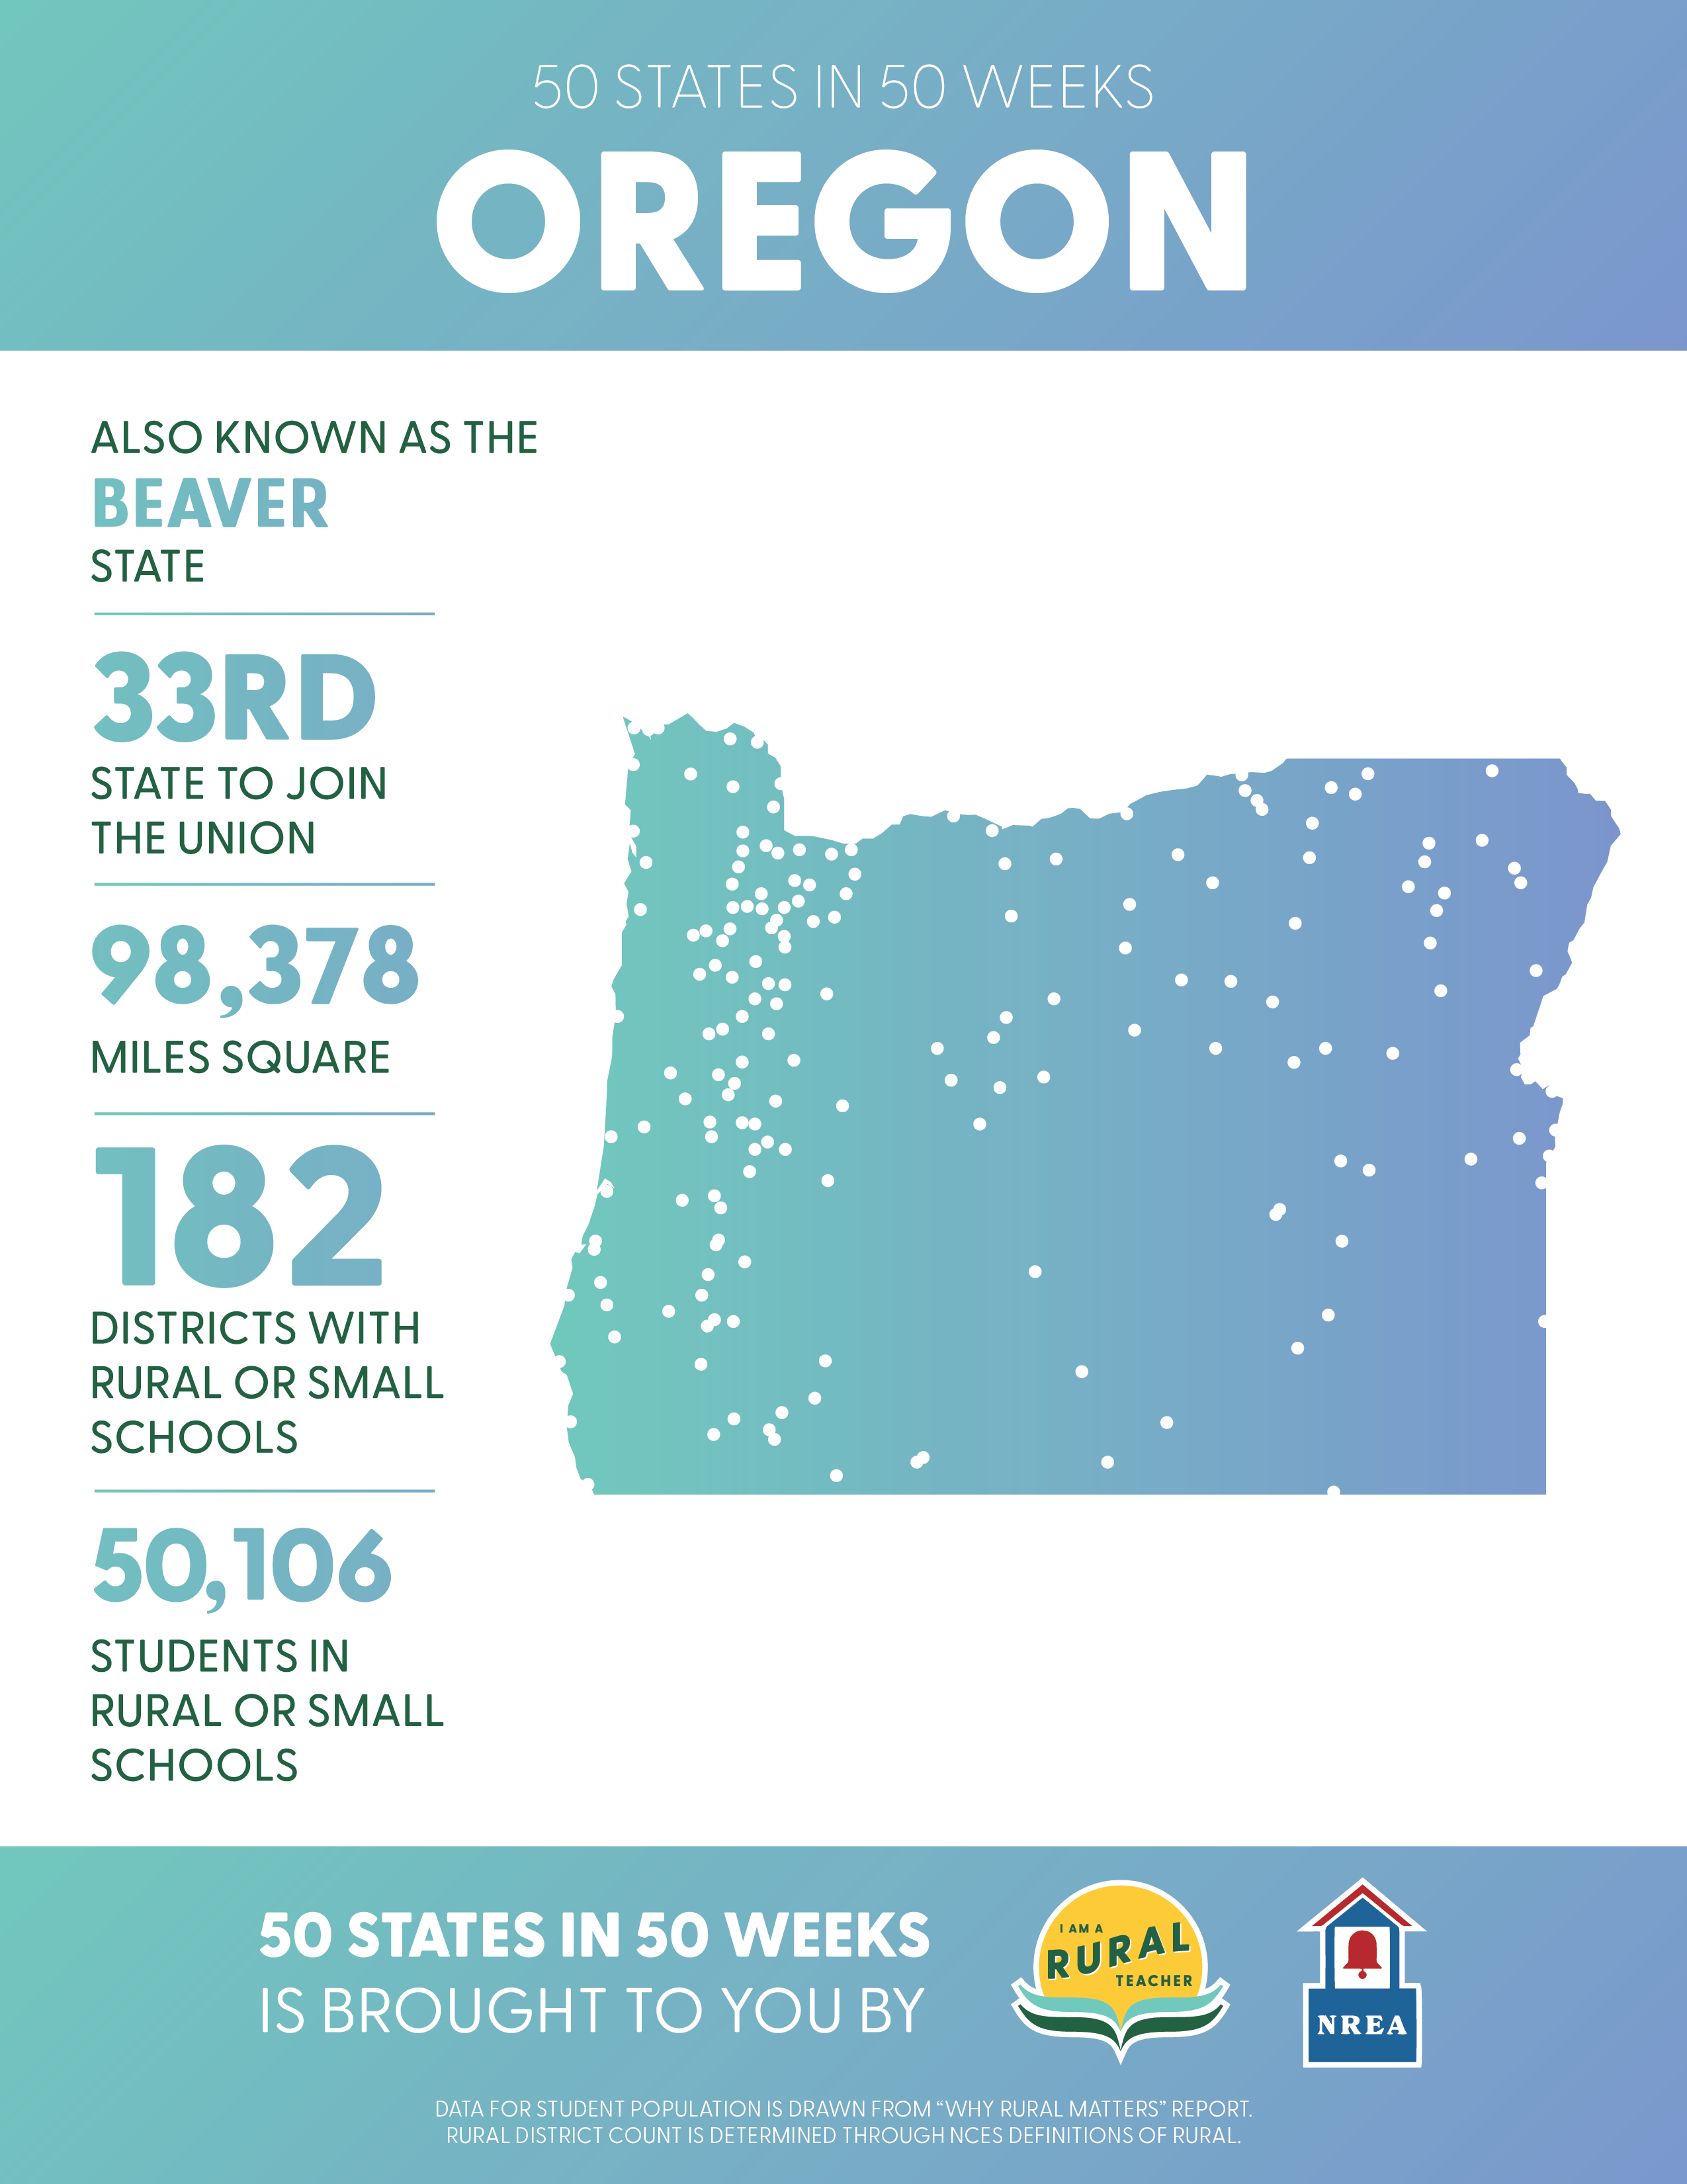
The 50 States in 50 Weeks Project was created to drive social media engagement for the IAART Campaign. Each week, I created a graphic showing the location of every district containing a rural school in a given state. These states are listed below in alphabetical order. Click any state to view it full-size.


Teacher Perspectives
On the marketing side, I assisted in facilitating a social media campaign for IAART. This included several projects meant to collect teacher perspectives so we could share them. I created the IAART Facebook page in January, and it now has over 1000 followers. I also collected over 100 perspectives, mostly through my COVID-19 Rural Community Impact Project. Finally, I created an interactive map showcasing the stories collected throughout the year, as well as a full map of the rural schools using data from the 50 States in 50 Weeks Project. This is included below.